Is net zero net positive? – Opportunities and challenges for pursuing a socio-economically sensitive net-zero transition for India

Abstract

At COP26 in Glasgow, India announced a long-term ambition to achieve net-zero greenhouse gas emissions by 2070. Existing emissions-economy modelling studies highlight that India’s emissions show no sign of peaking before mid-century and will not reach net zero by 2070 in a business-as-usual scenario with current policies. Using a mixed methodology of expert elicitation and system dynamics modelling, this article examines the policy gap that needs to be bridged for India to realize its net zero by 2070 commitment. The study discusses a socio-economically sensitive policy mix that could set India on a trajectory to peak its emissions in a decade and zero out its carbon dioxide (CO2) emissions by mid-century, leaving about one gigaton of other greenhouse gases to be decarbonized by 2070 to meet India’s net-zero goal. The policy mix realizes this goal while maintaining the government’s fiscal stability, and increasing employment and GDP beyond business-as-usual. The trajectory reported here is one of many possible low-carbon development pathways that could potentially be a net socio-economic positive for India. However, barriers such as the country’s lack of clean energy innovation and industrial policies, the gap between its domestic manufacturing capacity and deployment requirements, individual sector readiness for decarbonization, and the distributional implications of government revenue shifts through the energy transition remain significant challenges that need to be addressed to realize these potential socio-economic benefits of decarbonization.

Read more

Ambient air pollution and daily mortality in ten cities of India: a causal modelling study

Read the full study here

Summary

About this study
This is the first multi-city study in India that examines the association between short-term exposure to PM2.5 (particulate matter <2.5 microns in size) and daily mortality during the time period 2008-2019. We analyse the impact of these short-term PM2.5 exposures across cities in various geographic regions and climatological zones of the country to generate new insights that are relevant for policy.
 
What did we do?
We studied this in 10 cities (Ahmedabad, Bengaluru, Chennai, Delhi, Hyderabad, Kolkata, Mumbai, Pune, Shimla and Varanasi) between 2008 to 2019. We used a two-stage approach by first evaluating the effects of PM2.5 on mortality in each city individually, and then combining the results for all 10 cities. We also used a causal modelling approach that enabled us to isolate the effect of locally generated air pollution (such as contributions from local transport and waste burning) on mortality.
 
What data did we use?
We obtained daily counts of mortality from death registries of the 10 cities covered in this study for periods ranging from 3-7 years per city. Our final analysis included over 3.6 million deaths that occurred in these cities over the 2008-2019 study period. Given the sparse nature of air pollution data across many cities, we leveraged our previously developed machine-learning based exposure model that combined data from regulatory monitors, satellites, meteorology and other sources to generate PM2.5 exposure data with a high level of detail in both space (location) and time (duration).

What did we find?
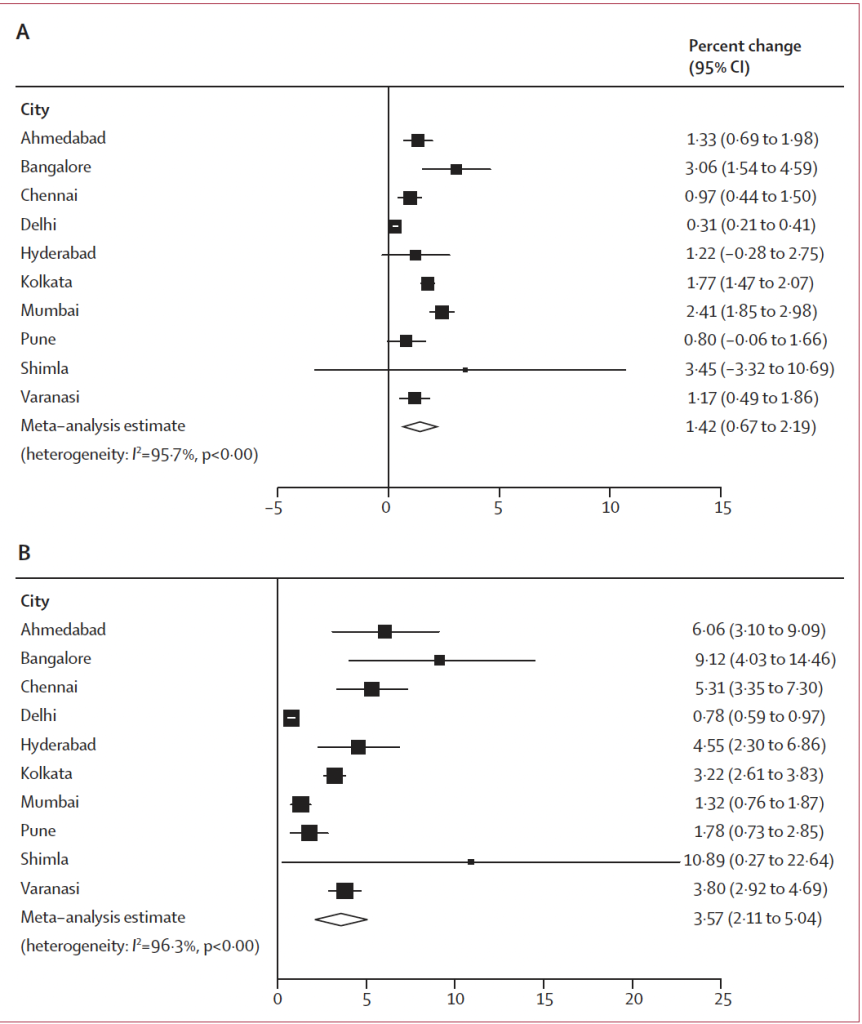
We found that for every 10 μg/m3 increase in the average PM2.5 exposure over a two-day period, the daily mortality across the ten cities increased by 1.42% (Figure 1A). When using our causal modelling approach that isolated the effect of locally generated air pollution, we observed a much stronger effect on daily mortality of 3.57% (Figure 1B).
 
Our findings also confirmed that the risk of mortality rose more quickly at lower PM2.5 levels but plateaued as levels increased. Significantly, we found mortality risk to be very high (2.65%) even when analysing days with PM2.5 levels below the current Indian NAAQS standard of 60 μg/m3.

Figure 1: City specific estimates of the association between short-term PM2.5 and mortality per 10 μg/m3 increase using conventional time-series approach (A) and causal modelling (B).


City-specific impacts
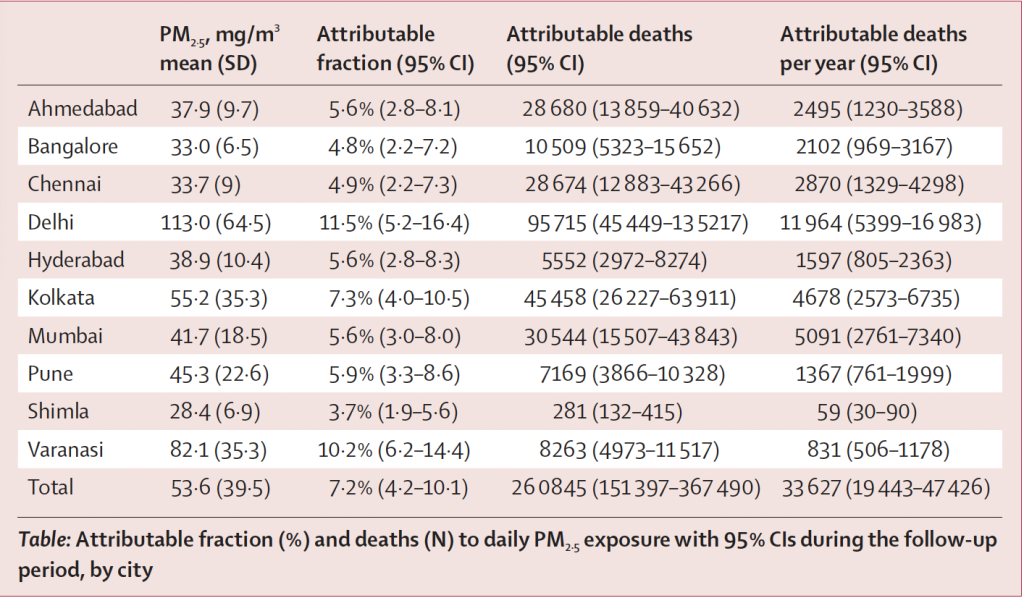
During our study period, we found that 7.2% (95% CI: 4.2-10.1) of all deaths across all 10 cities could be linked to PM2.5 exposure surpassing the WHO guideline value of 15 μg/m3. Delhi had the highest proportion at 11.5% (equating to ~12,000 deaths per year), while Shimla had the lowest at 3.7% (59 deaths per year) between 2008-19.
 
Over 33,000 deaths each year were attributable to short-term PM2.5 exposures with a significant number of deaths were observed even in cities not considered to have the problem of high air pollution (column 4 in table 1 below).

Table 1: Fraction of deaths (%) and number attributable to short-term PM2.5 exposure by city


Why do cleaner cities have higher effect estimates?
In our results, we see that cities such as Bengaluru and Shimla which have relatively lower levels of air pollution showed stronger effects. This is likely due to the sharp increase in risk at lower levels of exposure which plateaus at higher levels which are unlikely to be experienced in these cities (figure 2 below).

Figure 2: Effect of short-term exposure to PM2.5 on daily mortality at lower thresholds


What is the causal modelling approach we used and what new insights does it provide?
We used an instrumental variable approach to generate causal effects of locally generated air pollution. To do this, we identified three variables or “instruments” – planetary boundary layer height or mixing height, wind speed and atmospheric pressure – that are directly related to variations in daily air pollution, but are unrelated to daily deaths except through air pollution changes. Through this approach, we isolate the effect of locally generated air pollution since these three instruments are linked to dispersal and transport of air pollution.
 
The results show us a much higher effect estimate of 3.57% (95% CI: 2.11-5.04), indicating that we might have previously underestimated the effect of short-term air pollution exposures on mortality. The results also highlight the need for (a) greater focus on dispersed local sources of air pollution including transport, waste burning, DG sets, etc., and (b) greater research to unpack deeper insights into the potentially compounding effects of multiple locally generated pollutants (such as PM2.5 and oxides of nitrogen).
 
What are the implications for national and local air pollution policy?

There are several key takeaways from this study for the development and implementation of health-focused air pollution policy across India:

1. The combination of a steep increase in risk at lower exposure levels, along with significant effects even below the NAAQS standard of 60 μg/m3, show that air pollution is a problem across the country, and even in cities otherwise considered less polluted or to have been meeting air quality standards. Remedial action to mitigate air pollution should therefore expand beyond current “non-attainment” cities.

2. The current NAAQS are substantially higher than they should be as significant effects are seen well below current guideline value for daily exposure to PM2.5 of 60 μg/m3. As the NAAQS are currently under revision, the development of appropriate health-based thresholds can be informed by integrating these results into the standard-setting exercise.

3. Focus cannot only remain on seasonal high exposure events such as during winter, requiring action on all sources year-round. Graded Response Action Plans focused solely on these extremes would only yield marginal benefits with respect to daily mortality, with negative health effects continuing to accrue all year-round even at much lower exposure levels.

4. Our causal analyses highlight the need for greater attention on the numerous dispersed sources of local air pollution across cities including from transport and waste burning among others. These are more challenging to address, but could yield substantial health benefits.
 
What gaps remain in our understanding?
While our study had several strengths, we also encountered challenges that lead to certain gaps in our understanding of this relationship. First, the lack of accurate information on causes of death across all cities and the lack of data on sex, age and other individual-level variables for some cities made it challenging to generate deeper insights for both policymakers and health professionals. We anticipate the need for the strengthening of health data collection and quality to facilitate the generation of these insights. Second, the lowest PM2.5 concentration observed during the entire study period across any of the cities was 17.1 μg/m3, which therefore served as the counterfactual for our analyses. Evidence from other countries has documented considerable health harms even below these levels, and those data must be considered when identifying appropriate health-based thresholds and interventions.

Read more

Impact of heatwaves on all-cause mortality in India: A comprehensive multi-city study

Background


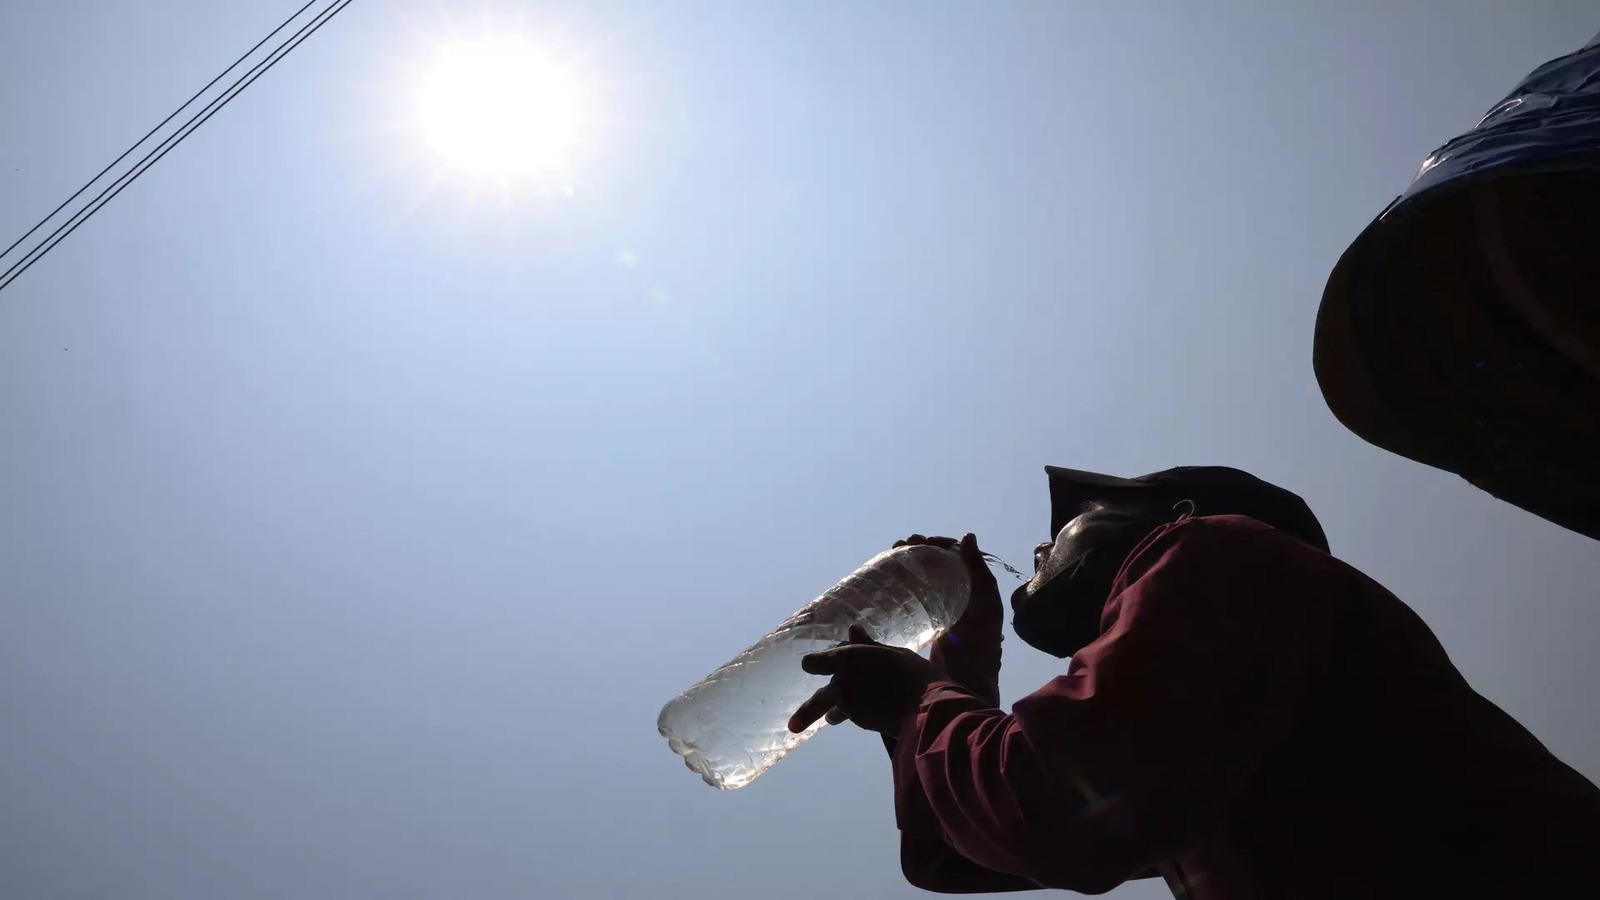
Heatwaves are expected to increase with climate change, posing a significant threat to population health. In India, with the world’s largest population, heatwaves occur annually but have not been comprehensively studied. Accordingly, we evaluated the association between heatwaves and all-cause mortality and quantifying the attributable mortality fraction in India.


Methods


We obtained all-cause mortality counts for ten cities in India (2008–2019) and estimated daily mean temperatures from satellite data. Our main extreme heatwave was defined as two-consecutive days with an intensity above the 97th annual percentile. We estimated city-specific heatwave associations through generalised additive Poisson regression models, and meta-analysed the associations. We reported effects as the percentage change in daily mortality, with 95% confidence intervals (CI), comparing heatwave vs non-heatwave days. We further evaluated heatwaves using different percentiles (95th, 97th, 99th) for one, two, three and five-consecutive days. We also evaluated the influence of heatwave duration, intensity and timing in the summer season on heatwave mortality, and estimated the number of heatwave-related deaths.


Findings


Among ∼ 3.6 million deaths, we observed that temperatures above 97th percentile for 2-consecutive days was associated with a 14.7 % (95 %CI, 10.3; 19.3) increase in daily mortality. Alternative heatwave definitions with higher percentiles and longer duration resulted in stronger relative risks. Furthermore, we observed stronger associations between heatwaves and mortality with higher heatwave intensity. We estimated that around 1116 deaths annually (95 %CI, 861; 1361) were attributed to heatwaves. Shorter and less intense definitions of heatwaves resulted in a higher estimated burden of heatwave-related deaths.


Conclusions


We found strong evidence of heatwave impacts on daily mortality. Longer and more intense heatwaves were linked to an increased mortality risk, however, resulted in a lower burden of heatwave-related deaths. Both definitions and the burden associated with each heatwave definition should be incorporated into planning and decision-making processes for policymakers.

Read more

Strategies for green industrial and innovation policy–an analysis of policy alignment, misalignment, and realignment around dominant designs in the EV sector

Summary

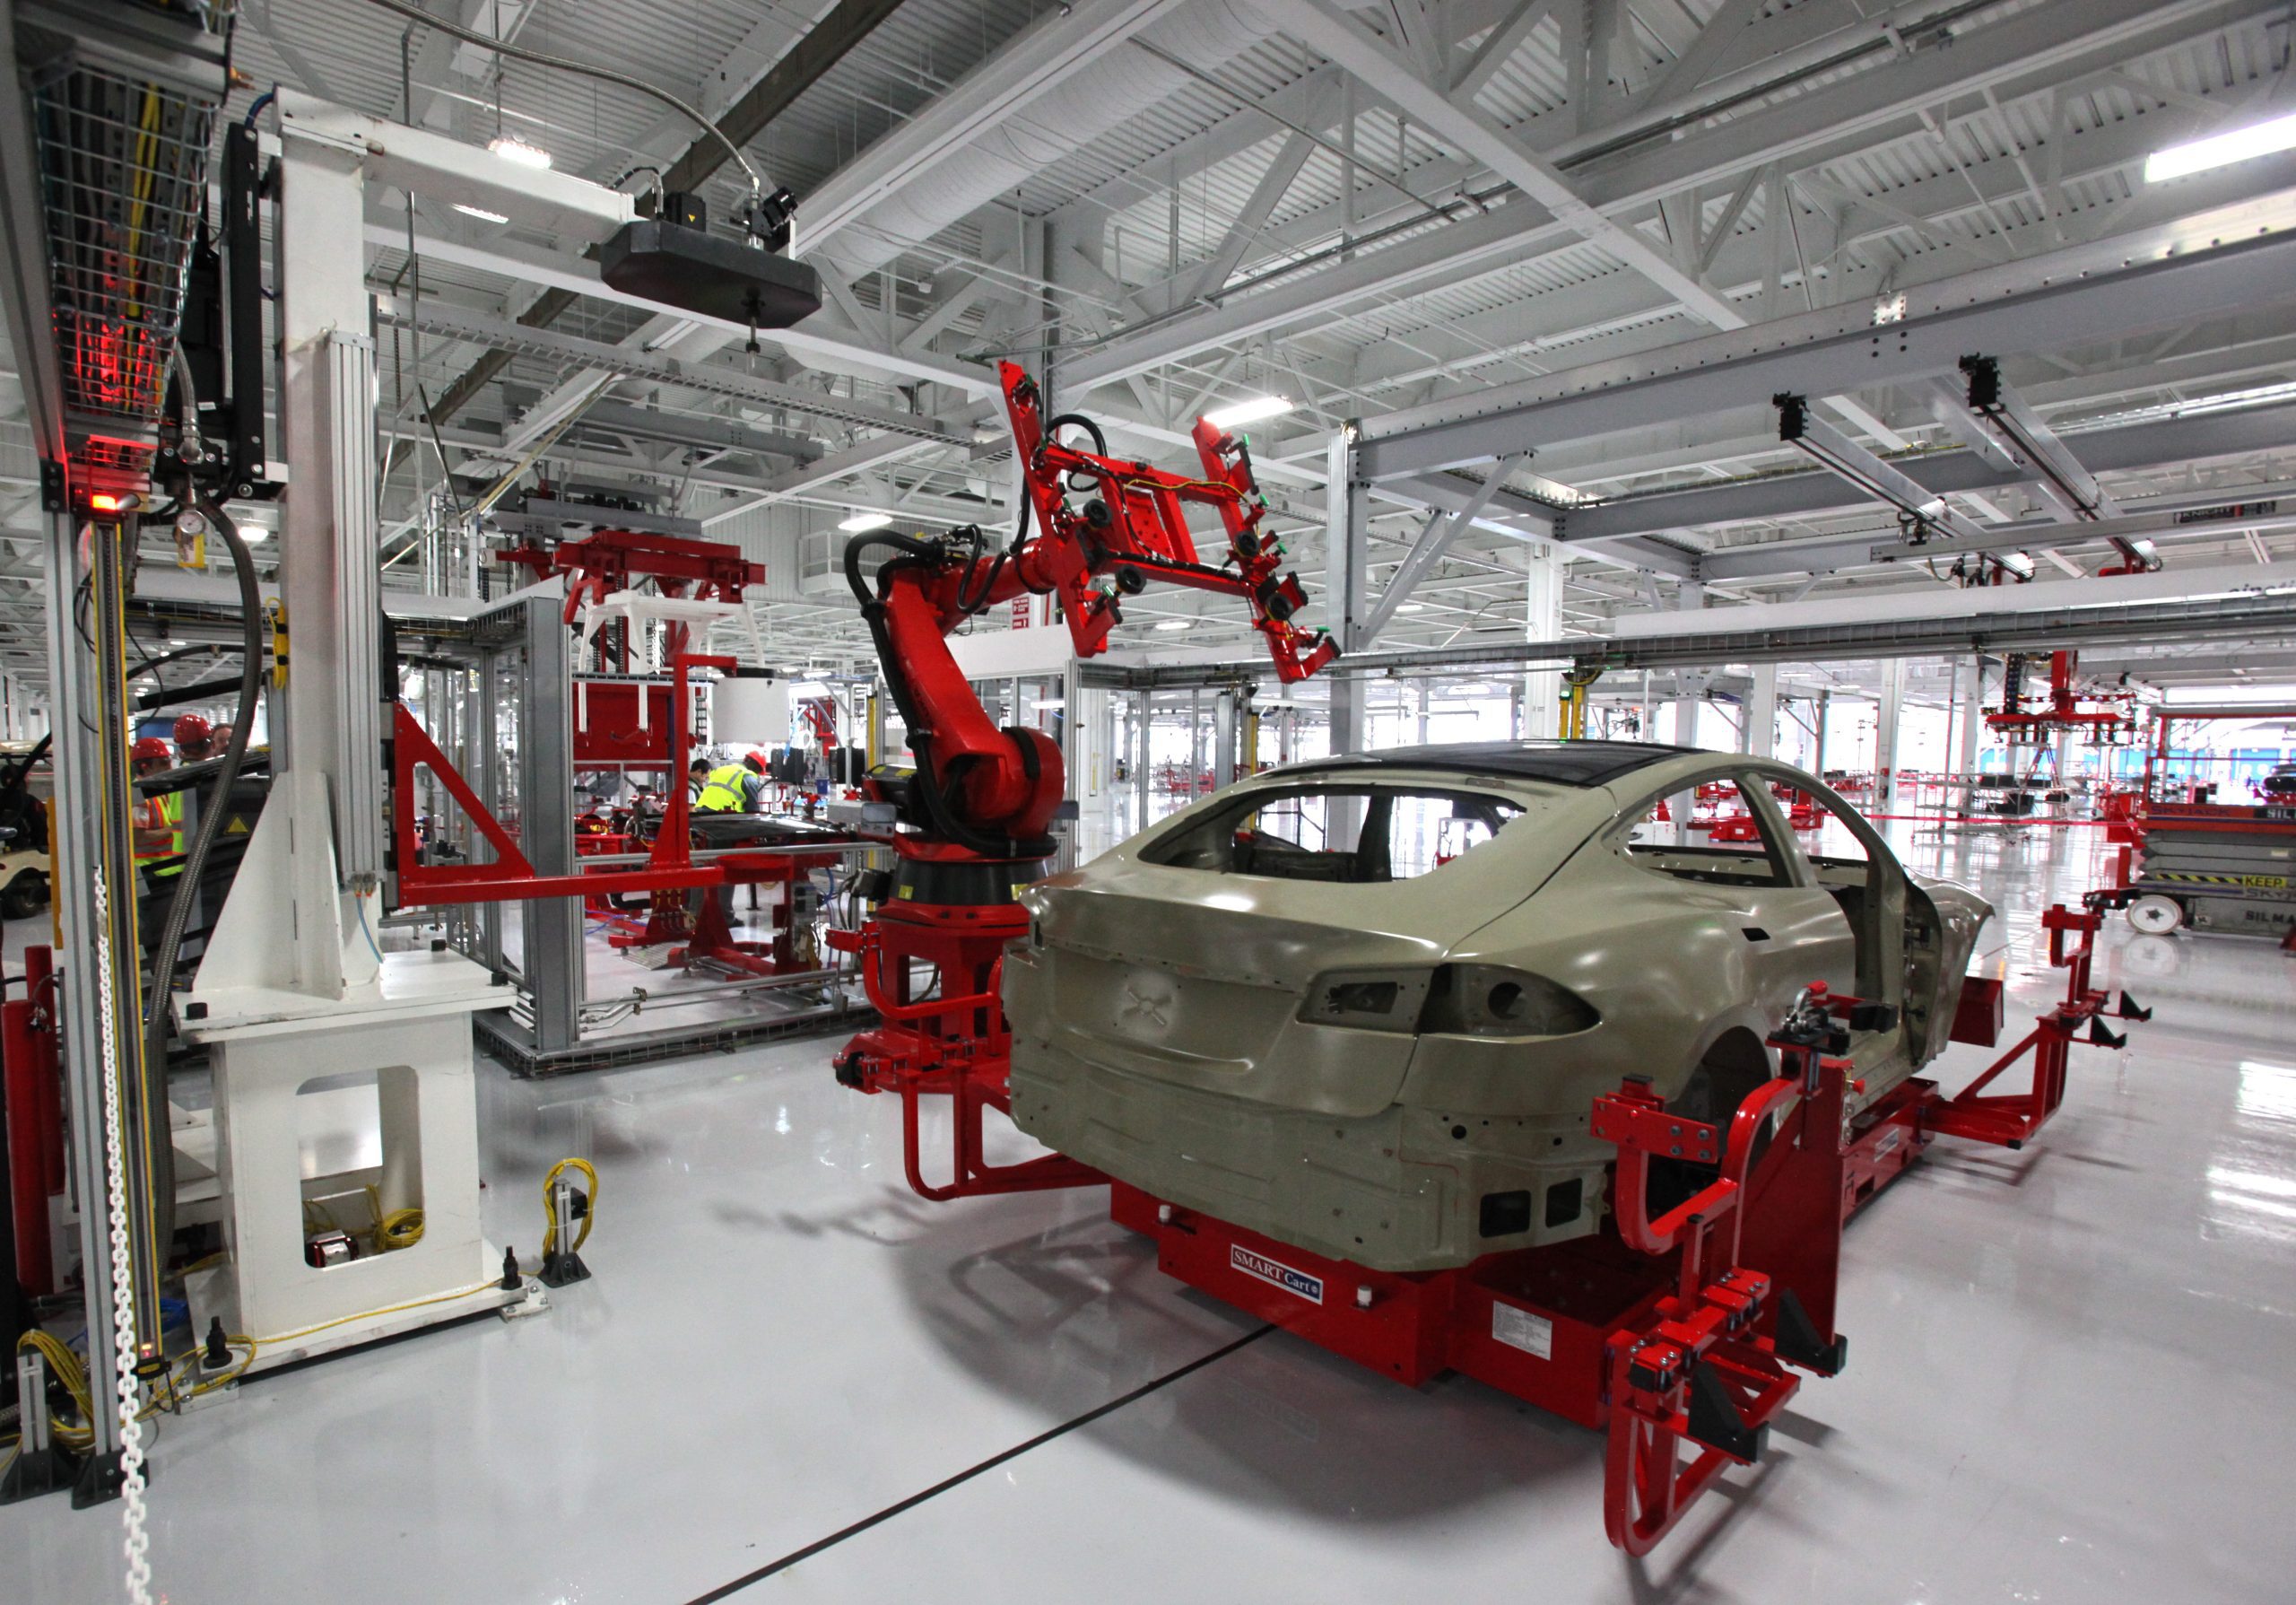
Governments in industrialized as well as emerging economies are racing to implement policies to accelerate clean energy innovation and capture the economic benefits of decarbonization. This paper explores which combination of technology-push and demand-pull policies best situates a country to lead in clean energy innovation, as new or dominant designs emerge and replace older technologies. A new analytical framework for green industrial policy is introduced regarding the alignment, misalignment, and deliberate misalignment of policies. This framework is applied to battery electric vehicle drivetrain technology to examine the use of policy alignment and misalignment by countries with big automakers as they pursue strategic green industrial policy. We find that countries that achieved early and sustained (not inconsistent) policy alignment gained a first-mover advantage compared with countries that deliberately or accidentally misaligned their policies. We also find that first-mover advantage can be lost due to deliberate misalignment of policies caused by an inability of governments to effectively incentivize their firms to develop and deploy cleaner and more efficient technologies. In situations where governments adopt misaligned or conflicting policies, incumbent industries tend to pursue their prior comparative advantage and maximize return from investments in prior technologies. We also find that deliberate misalignment of policies can be an effective catching-up strategy.

Read more

Intergenerational Labour and Just Transition in Coalfields

Introduction

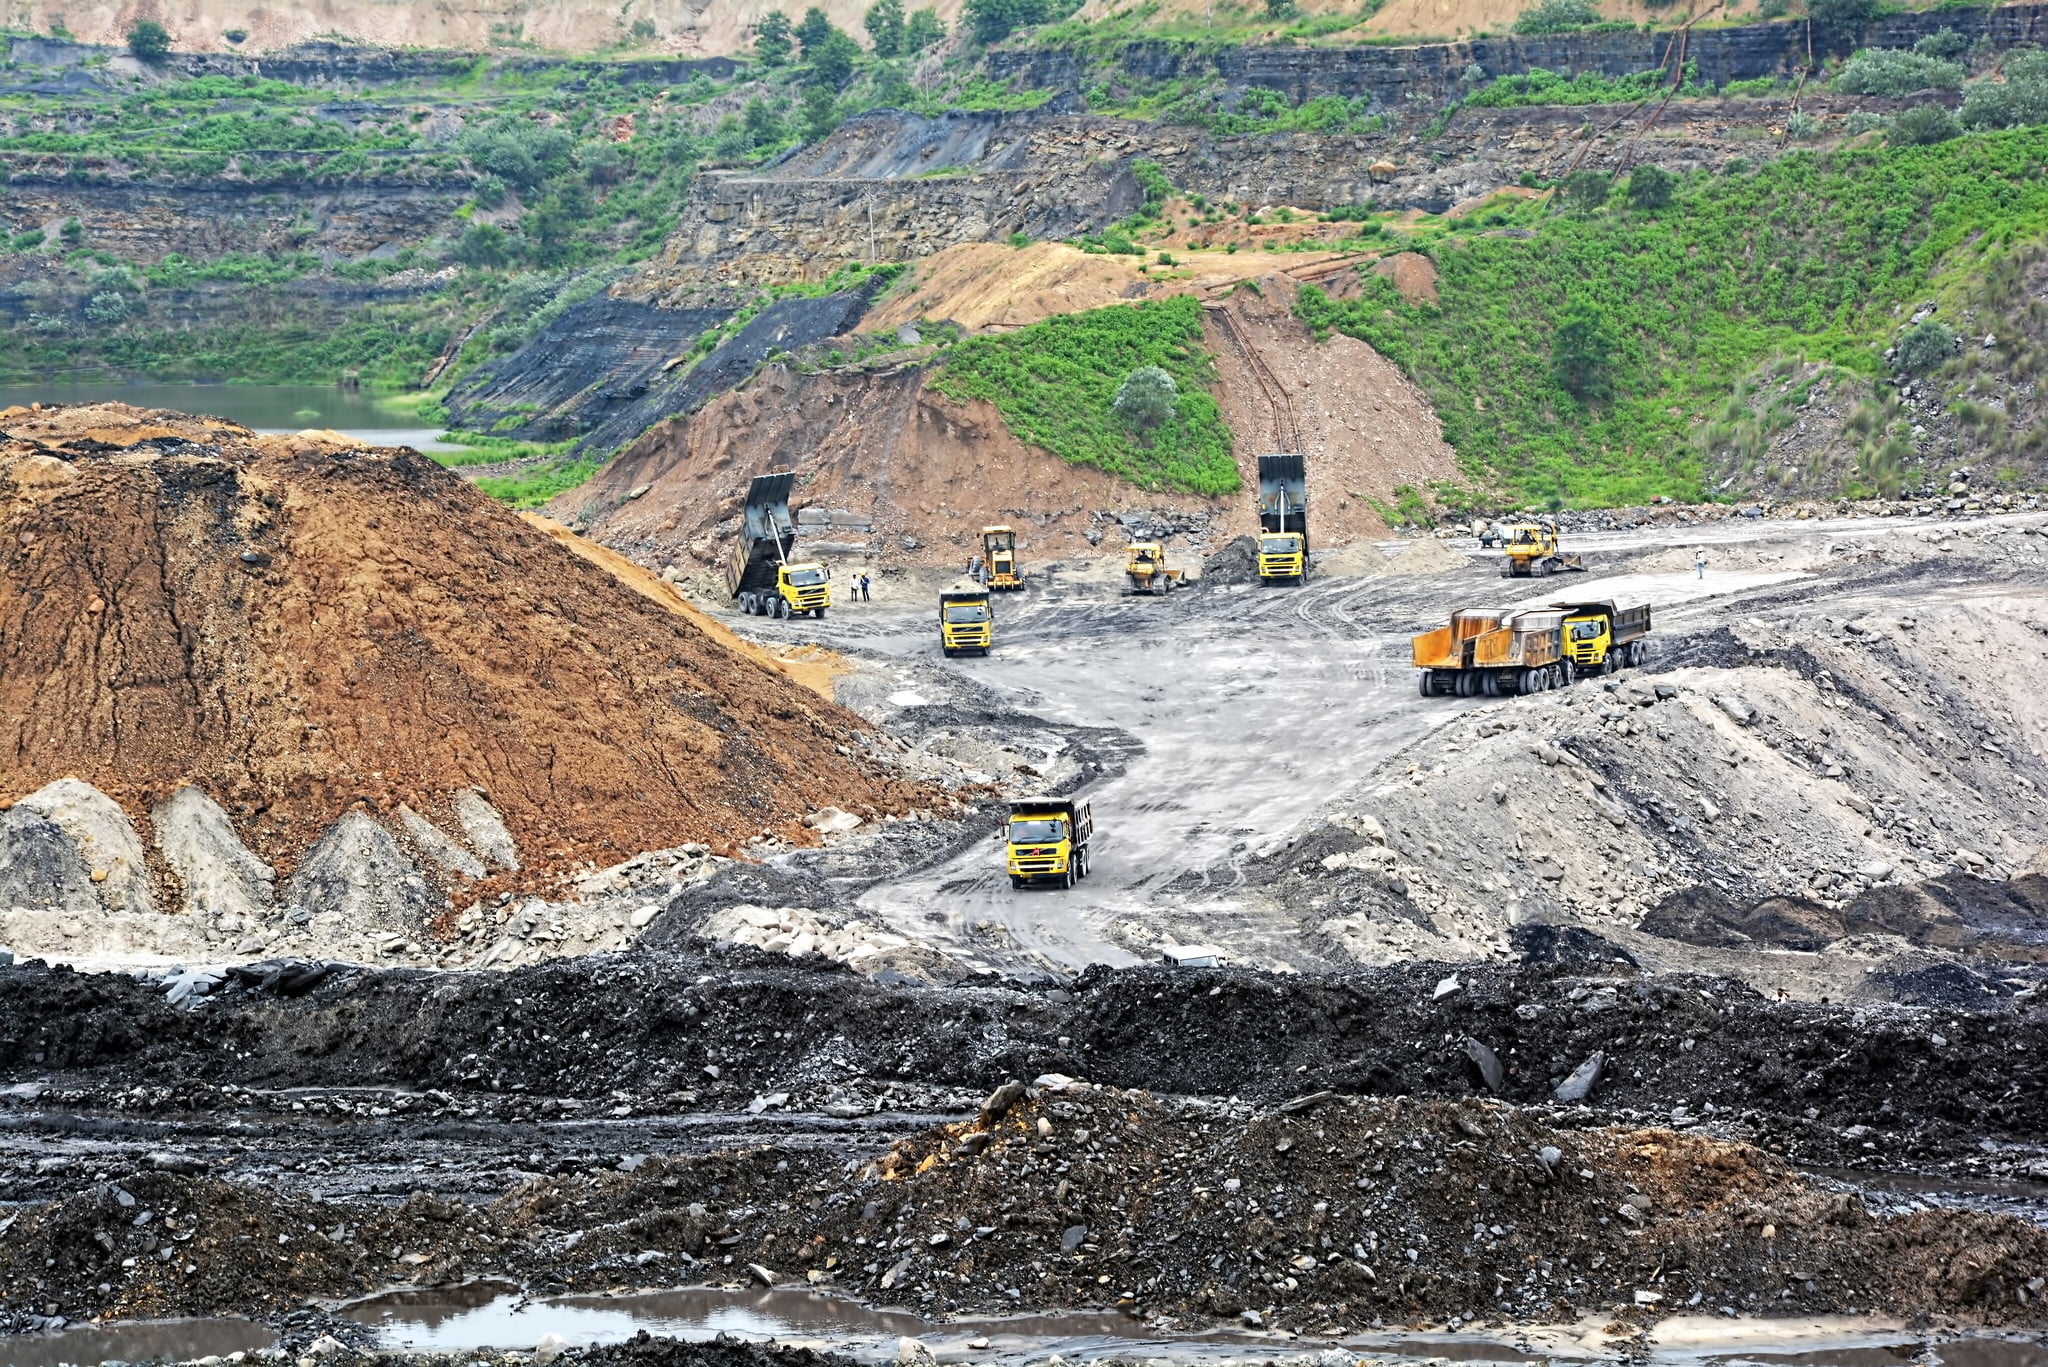
India’s coal dependency is more complex than that of countries in the Global North. Amidst deliberations on coal phase-down and just transition planning and strategies post COP-26, the intricacies of this dependence make any phase-down a delicate and intense socio-economic and political process. Apart from the country’s reliance on coal for energy security, this dependency is also spread across economy, especially amongst coal communities. More importantly, accounting for the impact on livelihoods and jobs of coal communities are at the core of coal dependency discussions in the country. There are two approaches to examine coal labour in India. The first is to map direct, indirect and induced employment and the other is to study formal and informal labour in the coal ecosystems. However, these studies largely focus on the magnitude of labour dependency.

Read more

What Is Polluting Delhi’s Air? A Review from 1990 to 2022

Introduction

Delhi’s annual average PM2.5 concentration in 2021–22 was 100 μg/m3—20 times more than the WHO guideline of 5 μg/m3. This is an improvement compared to the limited information available for the pre-CNG-conversion era (~30%), immediately before and after 2010 CWG (~28%), and the mid-2010s (~20%). These changes are a result of continuous technical and economic interventions interlaced with judicial engagement in various sectors. Still, Delhi is ranked the most polluted capital city in the world. Delhi’s air quality is a major social and political concern in India, often with questions regarding its severity and primary sources, and despite several studies on the topic, there is limited consensus on source contributions. This paper offers insight by reviewing the influence of Delhi’s urban growth since 1990 on pollution levels and sources and the evolution of technical, institutional, and legal measures to control emissions in the National Capital Region of Delhi.

Read more

Solar Rooftop Systems and the Urban Transition: Shall the Twain Ever Meet? Interrogations from Rewari, India

Summary

India is facing two major transitions. In 2040, its energy demand will double while 800 million Indians will live in cities by 2050. Situated at this intersection, this article contributes to the field of urban energy research by looking at Solar Rooftop Systems (SRS) in a district located in the extended periphery of Delhi. Using a multi-pronged qualitative methodology in a corridor made of villages and small towns, we argue that public policies are framed applying a rigid territorial grid opposing urban and rural, ignoring the motivations of both residential and professional users, which are not bounded by the rural/urban binary. This disjunction explains that renewable energy does not lead to a new imagination of urban and energy systems. These two fields remain disconnected while solar energy fuels consumption and the city expansion in its peripheries. Finally, the observed variegated urban energy landscapes (UEL) embody a land and energy intensive form of urban growth.

Read more

Coal extraction, dispossession and the ‘classes of labour’ in coalfields of eastern India

Introduction

Drawing upon long term fieldwork conducted in the coalfields of eastern India, the paper argues for the formation of multiple, fragmented and hierarchical ‘classes of labour’ in the ‘new public sector’ coal mines of India. Employing an intersectional lens, it shows that the organisation of ‘classes of labour’ is greatly dependent upon the differentiated negotiating powers for compensatory employments linked to pre-existing land and other social relations shaping up as ‘politics of incorporation’ in mining jobs. It demonstrates the exacerbation of socio-economic inequalities between Dalits, women and dominant caste and class communities in the dispossession process of open-cast coal mining.

Read more

Migrant Workers in the Coal Mines of India: Precarity, Resilience and the Pandemic

Abstract

This article analyses the lived experiences of migrant workers in India under different regimes of coal mining and engages with their contemporary precarious labouring conditions and resilience. Drawing from ethnographic fieldwork undertaken in the Talcher coalfields of Odisha, I argue that the labouring lives of migrant workers from marginalised communities have been invisiblised in a ‘shadow economy’ of coal extraction through subcontracting and labour recruitment by local contractors working with state-owned coal companies. The process of invisiblisation has taken place at three levels: first, at the workplace which includes recruitment patterns, contracting systems and precarious labouring conditions inflicted by the employer; second, through the exclusion of migrant workers in the land and labour politics of local dispossessed communities for coal mining jobs; and finally, caused by the COVID-19 pandemic and the consequent lockdowns, observed as ‘invisible’ essential workers under the Essential Services Maintenance Act of 1981.

Read more